In recent weeks, I’ve spent much of my time figuring out how to use all of your drawings to determine where the bubbles are in the Spitzer data. About a month ago we had a breakthrough. Thanks to a lengthy conversation with MWP science guru Matthew Povich, I realised that one of the reasons it is so hard to determine where a bubble should be drawn is that sometimes there is no right answer! There are many bubbles in the MWP that people would disagree on how to draw – the reason is that there is often not necessarily a right answer to the question “where is the bubble?”.
An example of just such a bubble is shown below, with all user drawings shown next to it. You can see that this bubble just isn’t that easy to draw and that there are even two or three structures within the image that one could call a bubble. Instead of trying to make this fit a rigid one-bubble definition, we realised that we should be using the human ability to recognise patterns. After all – this is exactly what you are all so good at, and computers are sometimes not.

Myself and Matthew decided that what we should do in these instances is simply allow two (or even three) bubbles to be deemed as ‘real’. The inner, red structure is a kind of bubble, and so is the open-ended green bubble just outside of it. One could also perceive a third bubble just below and to the left of these, and many people appear to have drawn just that. (This is in addition the multitude of smaller bubbles around the edge, of course). Whatever catalogue is produced by our data reduction, it probably should include at least the first two structures if enough people drawn them.
This decision has made creating a cleaned bubble catalogue much easier. The data reduction process described in my February blog post is still the process I’m using, although it has been greatly refined. More importantly, since February an enormous number of new bubbles have been drawn and this means the averaging process produces better results. Below you can see some results of the latest efforts and hopefully you’ll agree that what is being produced is a good catalogue, based on what you have all drawn. For the sake of testing, I am using one 3-by-2 degree section of the data. This is the region +12 degrees from the galactic centre and contains several interesting and complex features – which makes it a good testing ground.
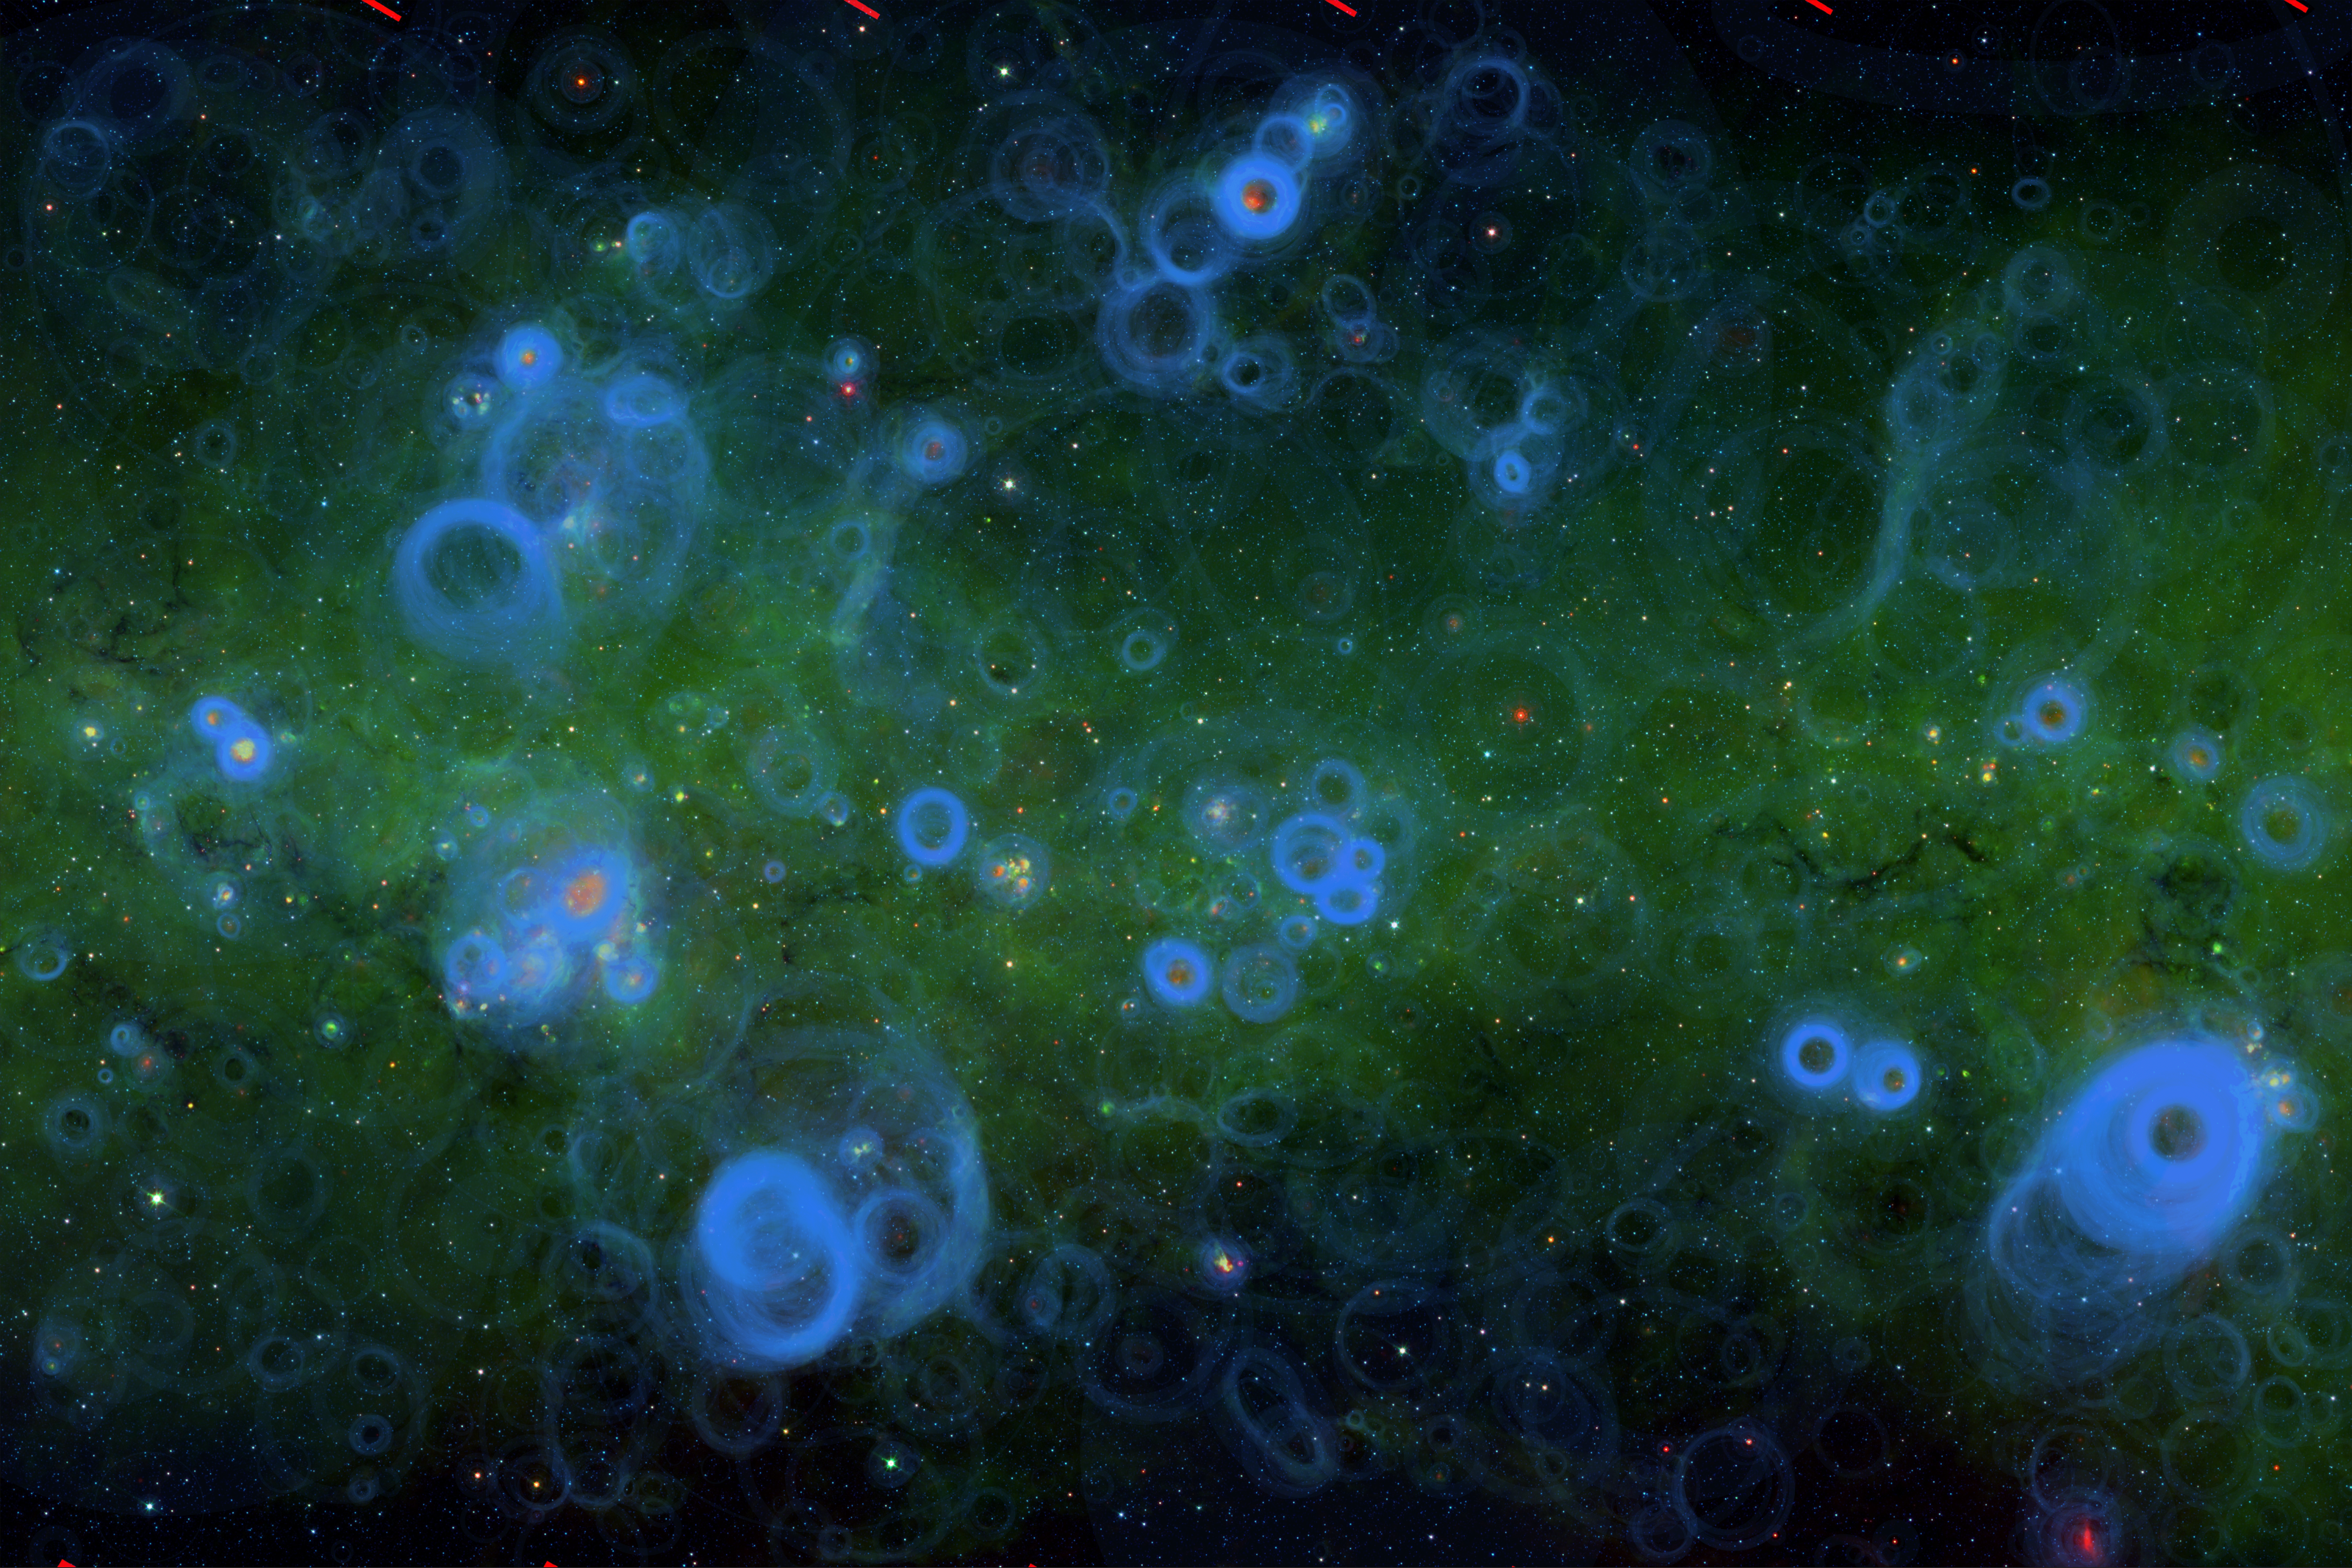
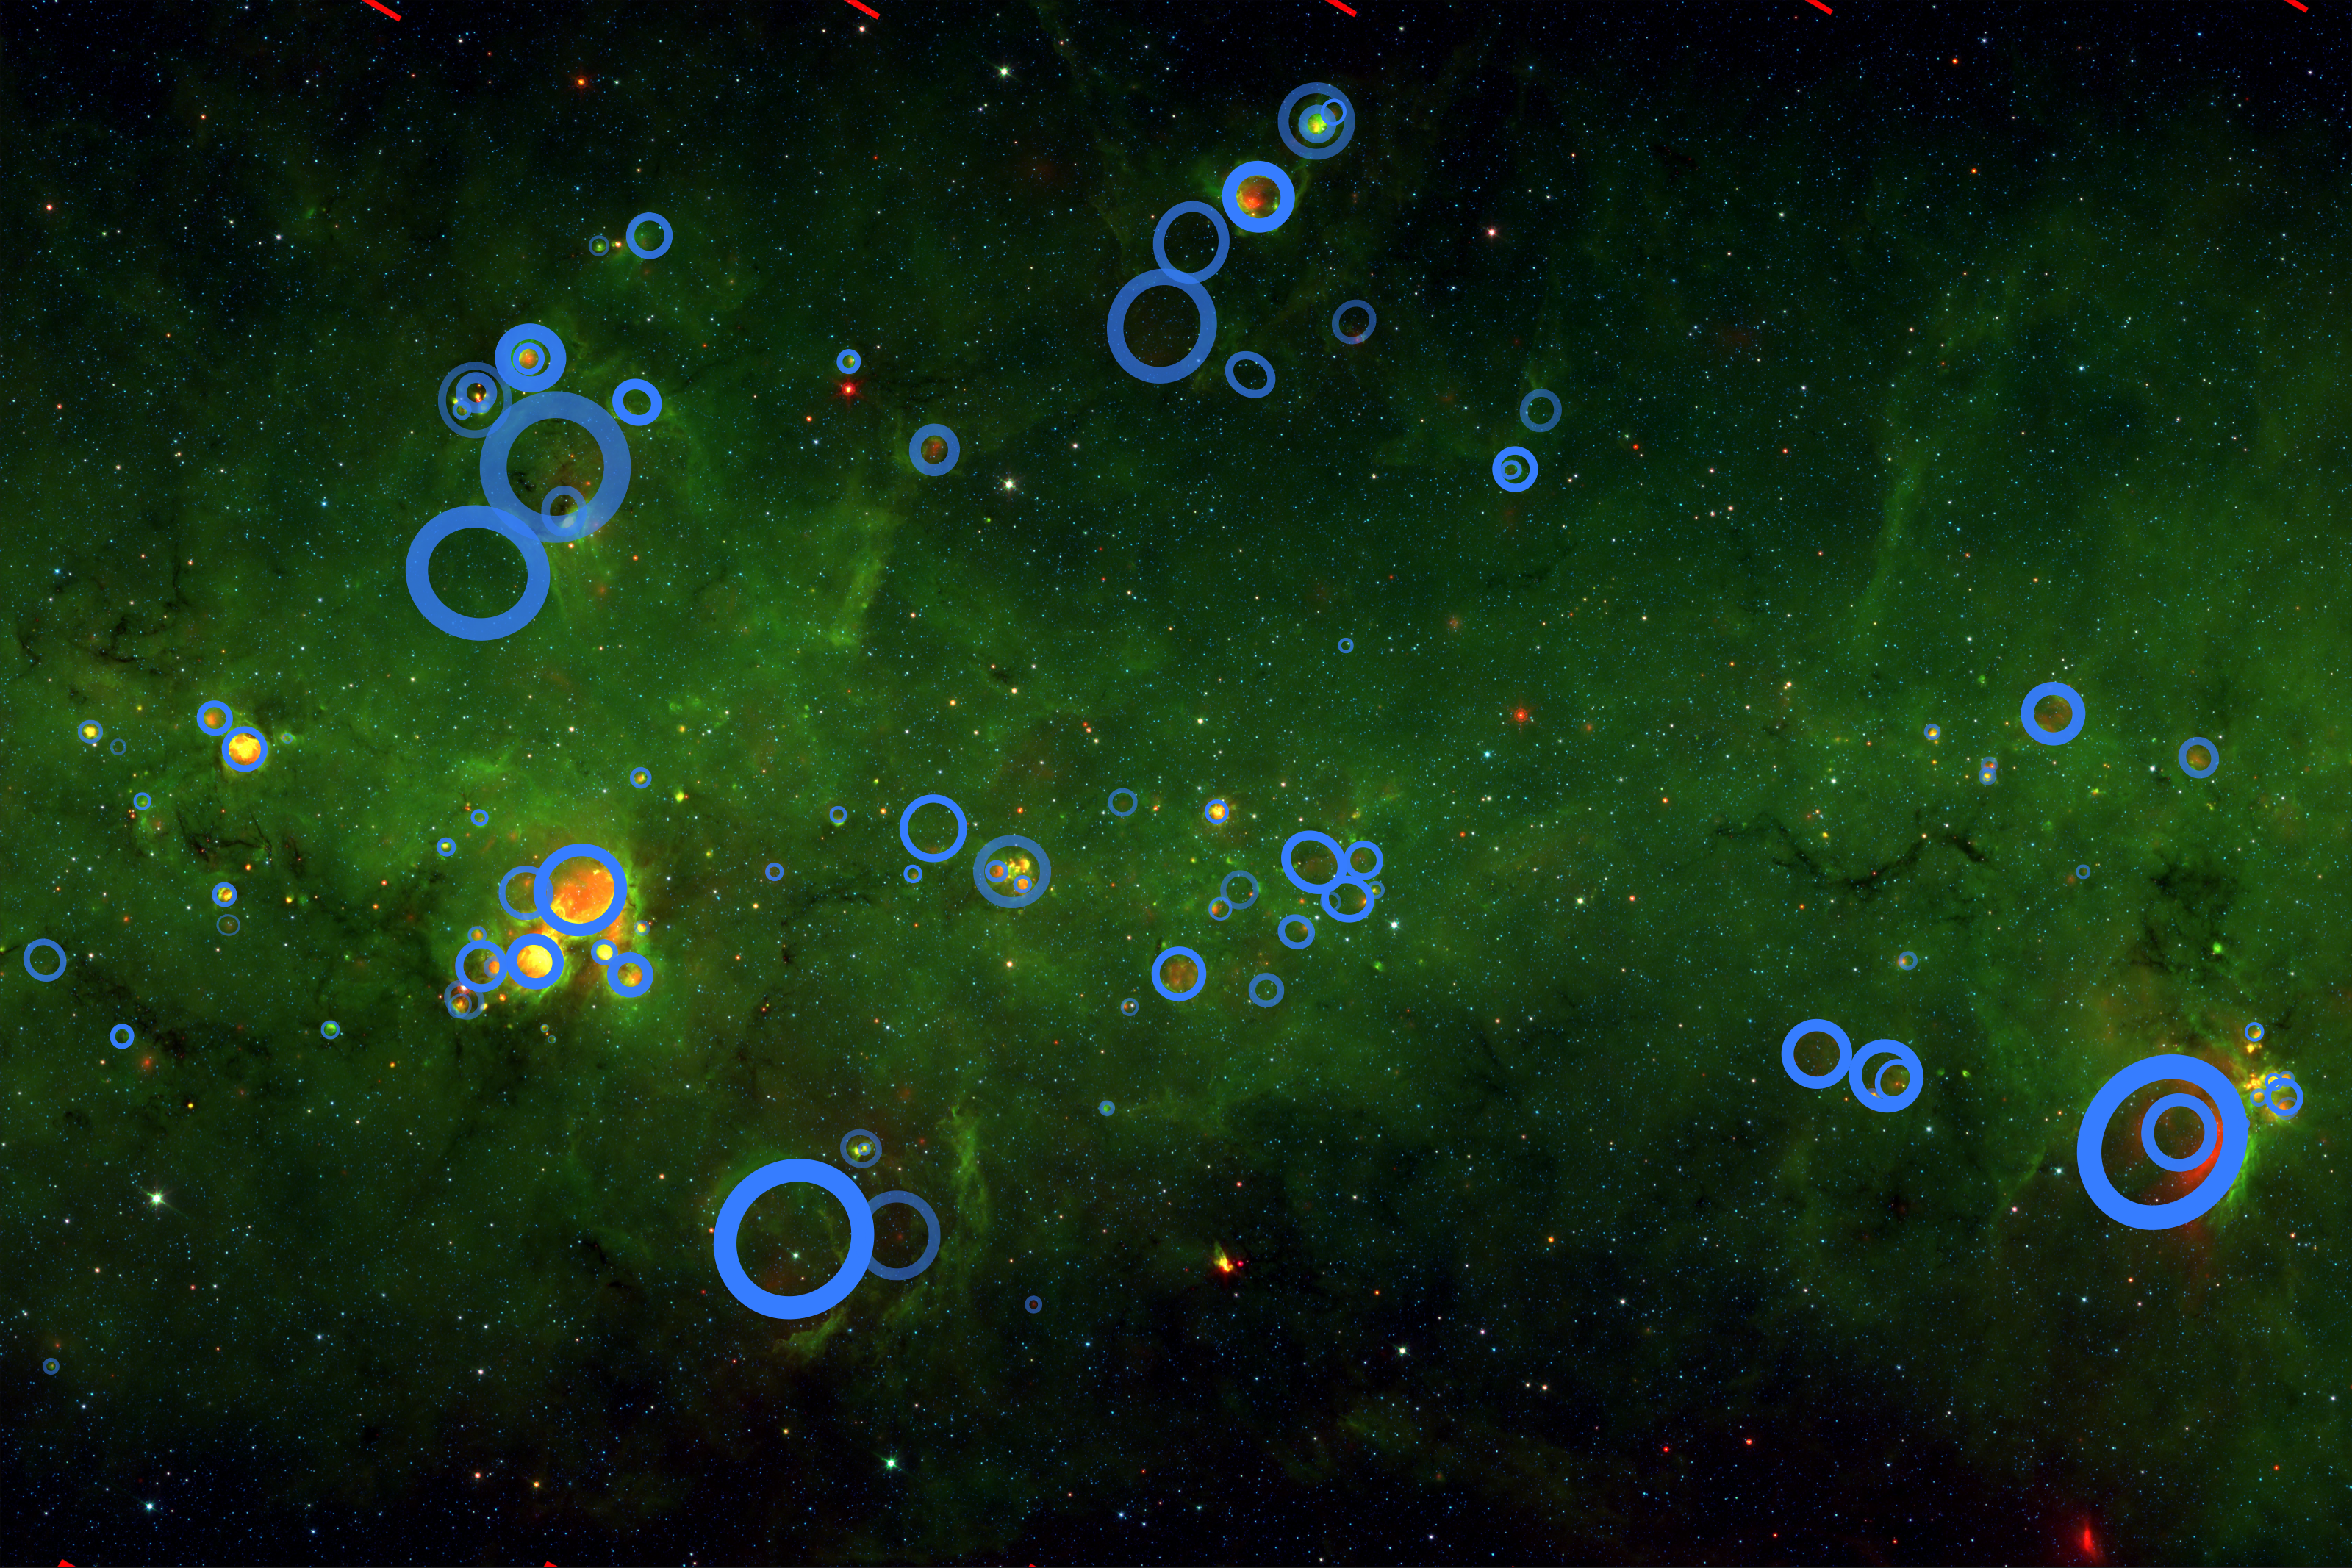
Below you can see the 3×2 degree tile on its own, with all of your 7,000+ bubbles drawn on top and with the resultant ‘cleaned’ bubbles as well. You can click on any of the images to see the full version.


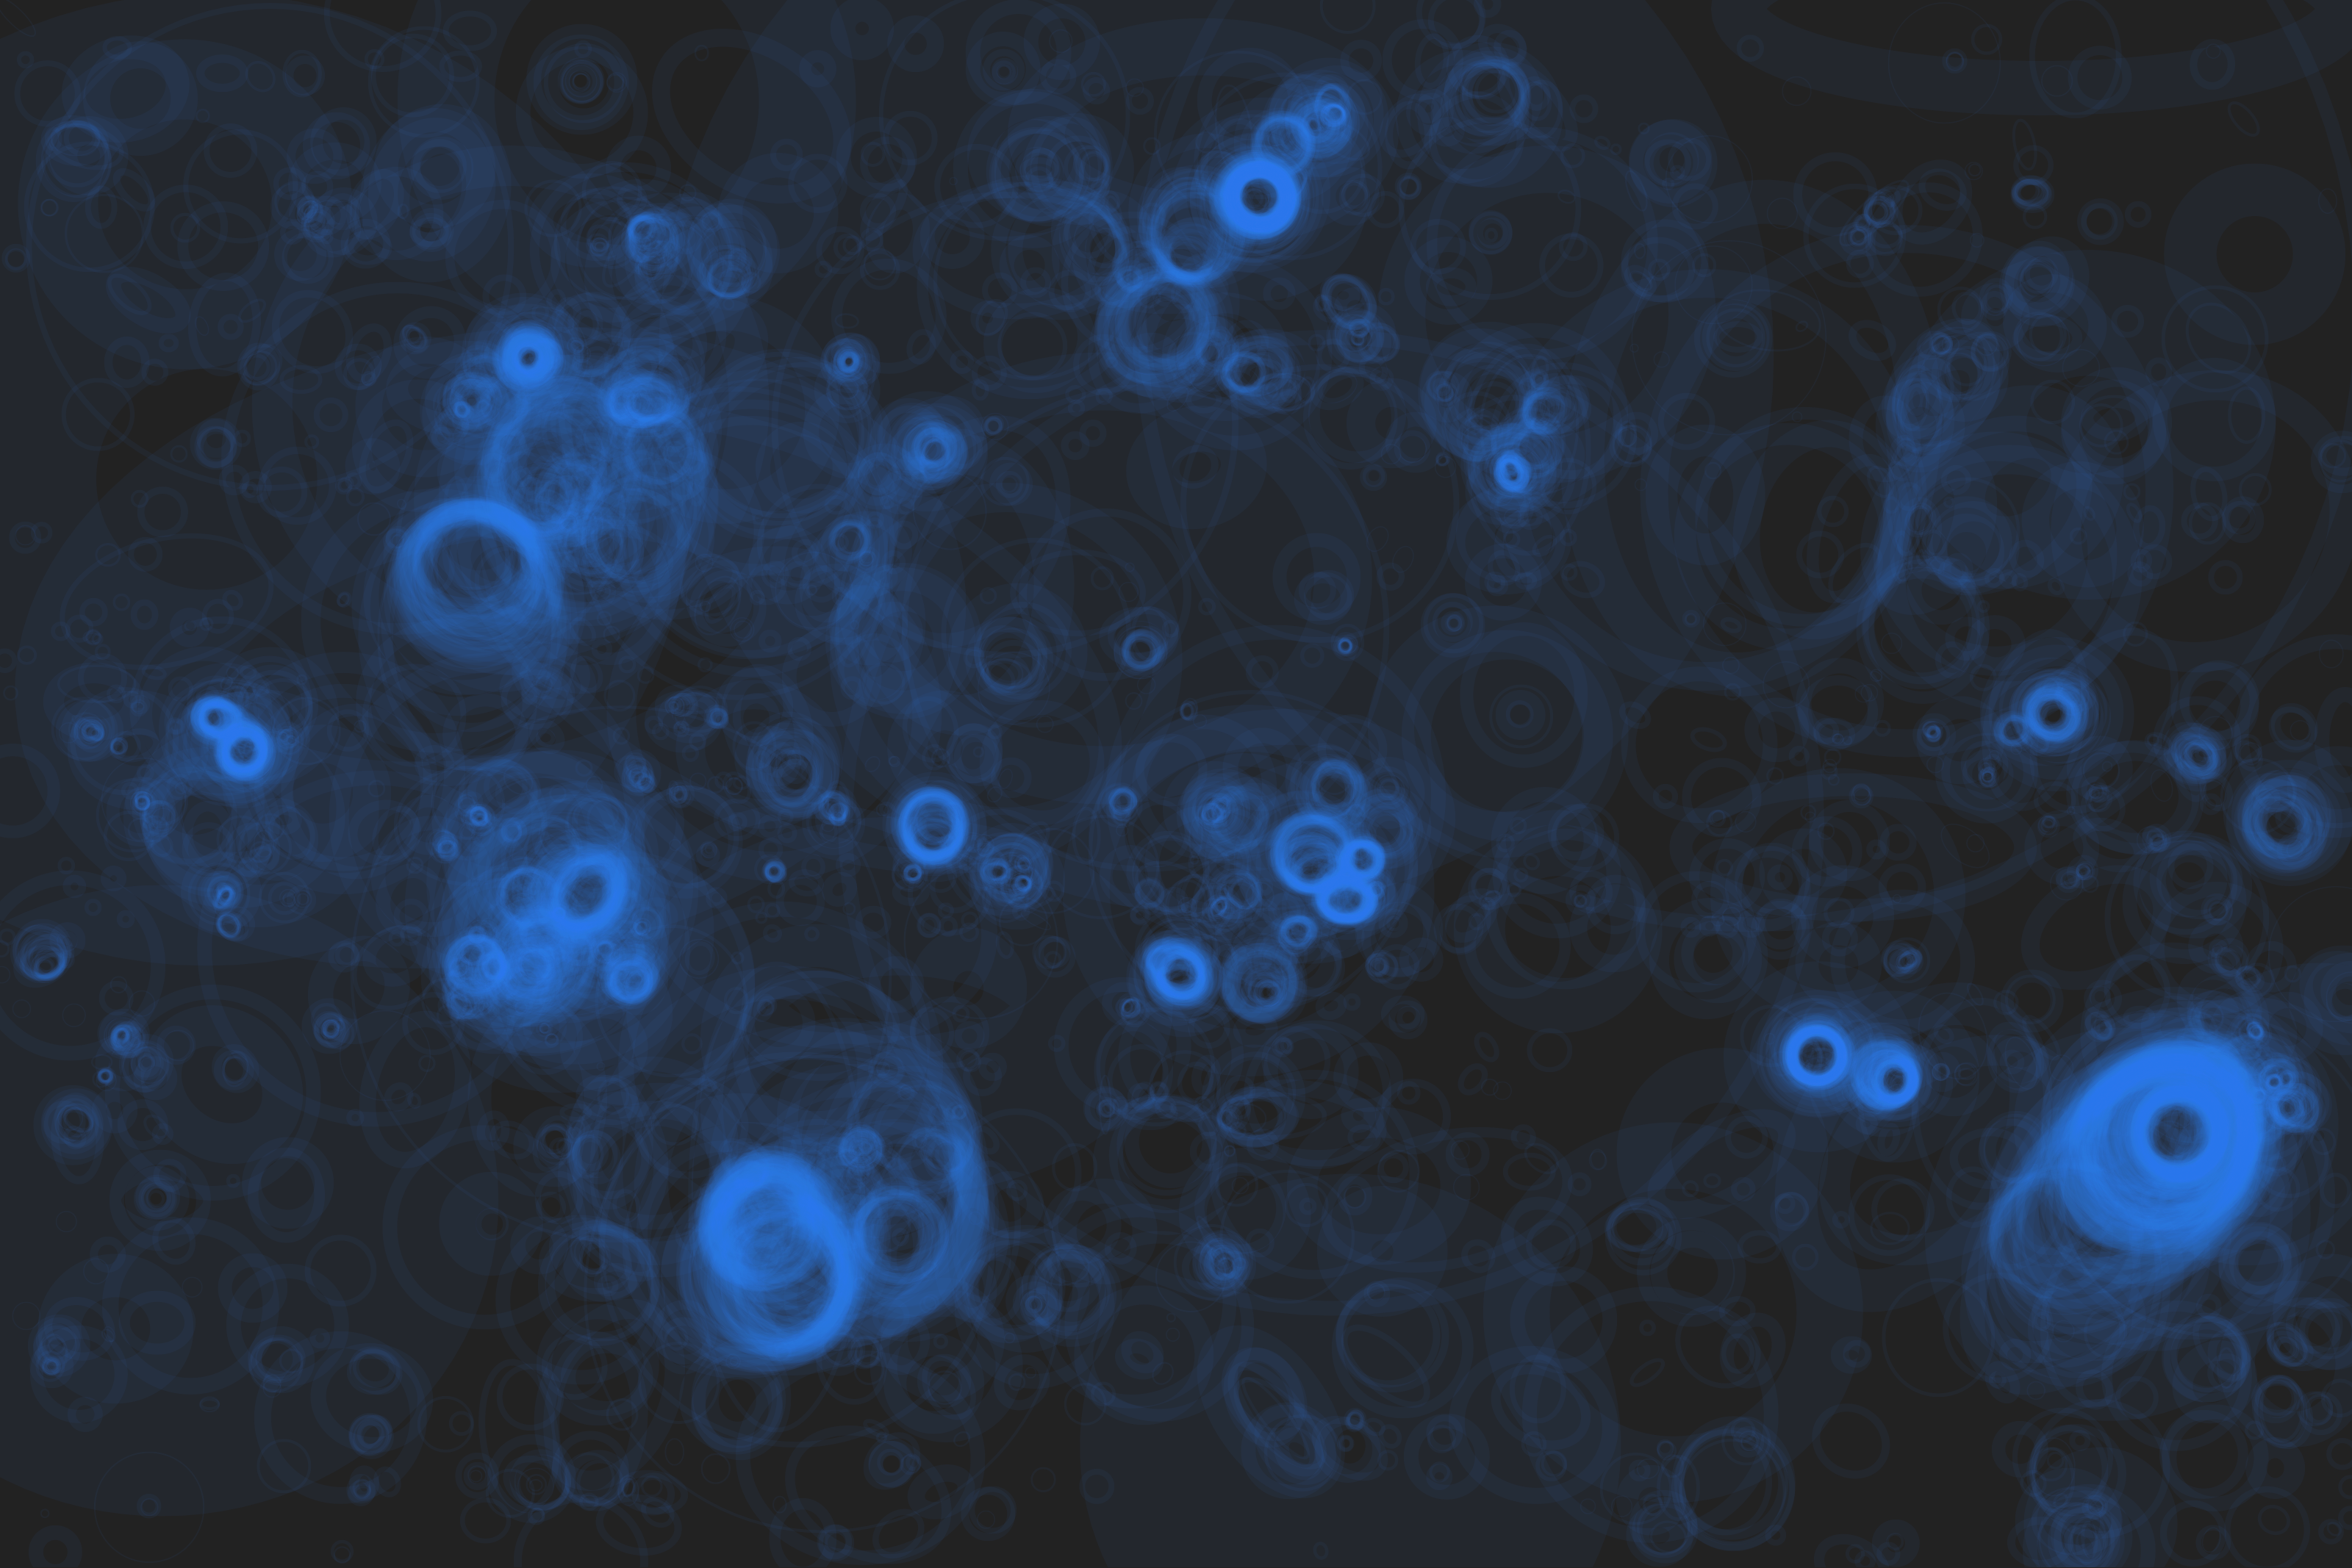
I have also been looking into other techniques for extracting the bubbles as the crowd sees them. Below you can see just the raw bubble data, drawn by users for this tile. With the background removed, we can use a simple contrast ratio to create a threshold, which we use to cut-out the bubbles from the original image.


This is another method for extracting data, and although it is harder to define a rigid catalogue of bubbles using this method, it may still have use in mapping regions of star formation in our galaxy.